Grafana
Welcome to the official Grafana Labs channel! You'll find tutorials about the Grafana LGTM Stack (Loki for logs, Grafana for ...
@Grafana subscribers

edureka!
Grafana Tutorial For Beginners | Continuous Monitoring With Grafana | DevOps Training | Edureka
4 years ago - 1:02:00
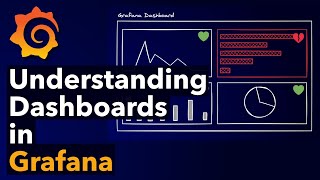
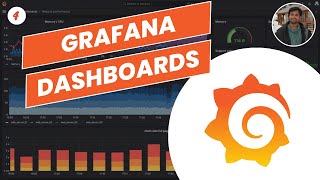
Grafana
Understanding Dashboards in Grafana | Panels, Visualizations, Queries, and Transformations
1 year ago - 5:52
Fireship
Grafana is the goat... Let's deploy the LGTM stack
5 months ago - 5:59

Vikas Jha
Grafana Course for Beginners | Learn Grafana | Grafana Tutorials
4 years ago - 3:57:48

Christian Lempa
Server Monitoring // Prometheus and Grafana Tutorial
3 years ago - 24:36

Grafana
Open Source Observability Explained - The Grafana Stack
1 year ago - 19:32

Grafana
Creating alerts with Grafana | Grafana for Beginners Ep 11
1 year ago - 16:50

Grafana
What is Observability? | Grafana for Beginners Ep. 1
1 year ago - 7:59

Piyush Garg
Server Monitoring with Grafana Prometheus and Loki
1 year ago - 51:44

ThePrimeTime
$5,500 A Month Saved From One Grafana Query
11 months ago - 40:28

SQL4automation
How To Setup A Grafana Dashboard Step By Step
5 years ago - 21:00

Techno Tim
Meet Grafana LOKI, a Log Aggregation System for EVERYTHING
3 years ago - 28:13

SkillsBuild
How to Setup a Grafana Dashboard Step-by-Step | Grafana Tutorial for Beginners
4 years ago - 16:02

Nick Chapsas
How to collect metrics and create dashboards using Grafana, Prometheus and AppMetrics in .NET Core
5 years ago - 27:15

Techno Tim
Beautiful Dashboards with Grafana and Prometheus - Monitoring Kubernetes Tutorial
2 years ago - 27:41

Grafana
Grafana 12 TL;DR: Observability as Code, Dynamic Dashboards & More Explained in 7 Min | Grafana Labs
2 months ago - 7:19

r2schools
How to Install and Configure grafana 12 on Kali Linux 2025.2 in 9 minutes! | 2025 Updated
2 weeks ago - 8:59

Tobi Teaches
Grafana Vs Prometheus | Which Monitoring Tool Is Better in 2025?
1 month ago - 1:33

VA2PT
New Relic vs Grafana Which Monitoring Tool Fits Your Needs?
7 months ago - 1:09

Versus Breakdown
Grafana Review: Free Version vs Grafana Cloud – Which Is Better? (2025)
12 days ago - 3:07

Tobi Teaches
Grafana Vs Superset | Which Data Visualization Tool Is Better in 2025?
1 month ago - 1:25

Tobi Teaches
Grafana Vs Power Bi | Which Data Visualization Tool Is Better in 2025?
1 month ago - 1:23

Volkov Labs
JSON Data Sources for Grafana | JSON API, Infinity, Simpod compared
2 years ago - 5:09

Jack Of All Tech
AirGradient with Home Assistant & Grafana: Full Smart Air Setup!
2 months ago - 8:54

Grafana
Get started with Grafana Alerting: Create and receive your first alert
2 days ago - 6:39

r2schools
How to Install and Configure Grafana 11.3 on Windows 10/11- Step-by-Step Guide | Grafana 11 Windows
7 months ago - 8:21

r2schools
How to Install and Configure grafana 12 on Ubuntu 24.04 LTS in 9 minutes! | 2025 Updated
3 weeks ago - 9:28

r2schools
How to Download Install and Configure Grafana 12.0 12 on Windows 11/10
3 weeks ago - 8:21

Cloud Champ
How Prometheus and Grafana works? #devops #monitoring
1 year ago - 0:37

r2schools
Unlock the Power of Data Visualization: Install Grafana 11.5 on Ubuntu 24.04 in 10 Minutes! | 2025
3 months ago - 9:57

Grafana
Grafana Labs is a Leader in the 2025 Gartner® Magic Quadrant™ for Observability Platforms
3 days ago - 2:56

Abhishek.Veeramalla
DAY-42 | KUBERNETES MONITORING USING PROMETHEUS & GRAFANA |LIVE DEMO |STEPS IN GITHUB | #kubernetes
2 years ago - 40:54

KPeyanski
Is Grafana and InfluxDB really needed for a Home Assistant setup?
1 year ago - 0:24

Docker
Empowering Web App Developers with Docker Desktop and Grafana Cloud #docker #grafana #devops
1 year ago - 0:11

Grafana
Grafana Assistant Creates a Dashboard "Out of Thin Air" | AI-Powered Observability | Grafana Labs
1 month ago - 0:42

Grafana
Exploring logs, metrics, and traces with Grafana | Grafana for Beginners Ep. 7
1 year ago - 12:57
Grafana
Grafana Learning Journeys: Send metrics to Grafana Cloud using Prometheus remote write
4 days ago - 6:31
Grafana
Grafana 12 TL;DR: Observability as Code, Dynamic Dashboards & More Explained in 7 Min | Grafana Labs
2 months ago - 7:19

Milan Jovanović
This .NET Monitoring Setup Changes Everything: Grafana + OpenTelemetry
12 days ago - 11:11

Grafana
Grafana 12 in Action: Git Sync, Observability as Code, Dynamic Dasbboards, New APIs, SCIM, and More
1 month ago - 1:20:33
Nick Chapsas
How to collect metrics and create dashboards using Grafana, Prometheus and AppMetrics in .NET Core
5 years ago - 27:15

Rayan Slim
Grafana & Prometheus Tutorial: Create a COMPLETE Dashboard
7 months ago - 57:22

SubnetSavy
“Monitor Your Kubernetes Cluster in 60 Seconds (Prometheus + Grafana Setup)”
3 weeks ago - 0:21

Jim's Garage
Homelab Monitoring Made Easy - Part 1: Tools Overview - Grafana, Prometheus, InfluxDB, Telegraf
1 year ago - 25:28

Techdox
Effortless Server Monitoring: Install Grafana, Prometheus & Node Exporter with Docker!
1 year ago - 32:12

Volkov Labs
Calendar panel 2.1.0 for Grafana #grafana #grafanaplugins #community #opensource
1 year ago - 0:52