Grafana
Welcome to the official Grafana Labs channel! You'll find tutorials about the Grafana LGTM Stack (Loki for logs, Grafana for ...
@Grafana subscribers

Rapid Guides
PROMETHEUS VS GRAFANA VS DATADOG – WHICH MONITORING TOOL IS BEST IN 2025?
1 month ago - 1:18

Smart Home Australia
InfluxDB and Grafana - Installation and Configuration in 5 minutes, PLUS Dashboard creations
1 year ago - 15:22

edureka!
Grafana Tutorial For Beginners | Continuous Monitoring With Grafana | DevOps Training | Edureka
4 years ago - 1:02:00

cloudnixiass
📊 Grafana vs. Prometheus: 5 Key Features and 4 Crucial Differences | DevOps Monitoring Tools 🚀
1 year ago - 24:11

Fireship
Grafana is the goat... Let's deploy the LGTM stack
5 months ago - 5:59

AI & DevOps Toolkit
The Best Performance And Load Testing Tool? k6 By Grafana Labs
3 years ago - 36:08

Tobi Teaches
Grafana Vs Prometheus | Which Monitoring Tool Is Better in 2025?
1 month ago - 1:33

Christian Lempa
Grafana Alloy, NEW log + metric collector replaces everything!
8 days ago - 35:03

Grafana
Understanding Dashboards in Grafana | Panels, Visualizations, Queries, and Transformations
1 year ago - 5:52

Grafana
Grafana k6 1.0 Overview and Demo: TypeScript, Extensions, More | What's New | Grafana Labs
2 months ago - 6:19

Volkov Labs
JSON Data Sources for Grafana | JSON API, Infinity, Simpod compared
2 years ago - 5:09

CodeOps By Mo
Part 1: Collecting Logs With Grafana Alloy And Sending Them To Loki
5 months ago - 1:11:33

Grafana
What is Observability? | Grafana for Beginners Ep. 1
1 year ago - 7:59

Amazon Web Services
Demo Video - Amazon Managed Service for Prometheus (AMP) & Amazon Managed Service for Grafana (AMG)
4 years ago - 3:55

Tobi Teaches
Grafana Vs Power Bi | Which Data Visualization Tool Is Better in 2025?
1 month ago - 1:23

Christian Lempa
Server Monitoring // Prometheus and Grafana Tutorial
3 years ago - 24:36

r2schools
How to Install and Configure grafana 12 on Kali Linux 2025.2 in 9 minutes! | 2025 Updated
2 weeks ago - 8:59

Tobi Teaches
Grafana Vs Superset | Which Data Visualization Tool Is Better in 2025?
1 month ago - 1:25

Tobi Teaches
Grafana Vs Tableau | Which Data Visualization Tool Is Better in 2025?
1 month ago - 1:17

Jack Of All Tech
AirGradient with Home Assistant & Grafana: Full Smart Air Setup!
2 months ago - 8:54

r2schools
How to Install and Configure grafana Enterprise 12.0 on Debian 12.11/11
3 weeks ago - 9:34

Grafana
Open Source Observability Explained - The Grafana Stack
1 year ago - 19:32

r2schools
How to Install and Configure Grafana 11.3 on Windows 10/11- Step-by-Step Guide | Grafana 11 Windows
7 months ago - 8:21

Cloud Champ
How Prometheus and Grafana works? #devops #monitoring
1 year ago - 0:37

r2schools
How to Install and Configure grafana 12 on Ubuntu 24.04 LTS in 9 minutes! | 2025 Updated
4 weeks ago - 9:28

r2schools
How to Download Install and Configure Grafana 12.0 12 on Windows 11/10
4 weeks ago - 8:21

r2schools
Unlock the Power of Data Visualization: Install Grafana 11.5 on Ubuntu 24.04 in 10 Minutes! | 2025
3 months ago - 9:57

Piyush Garg
Server Monitoring with Grafana Prometheus and Loki
1 year ago - 51:44

SQL4automation
How To Setup A Grafana Dashboard Step By Step
5 years ago - 21:00

Grafana
Creating alerts with Grafana | Grafana for Beginners Ep 11
1 year ago - 16:50

Docker
Empowering Web App Developers with Docker Desktop and Grafana Cloud #docker #grafana #devops
1 year ago - 0:11

Bhoopesh Sharma
Grafana Dashboard Tutorial | How to Setup a Grafana Dashboard Step-by-Step | Grafana Tutorial
2 years ago - 22:24

SkillsBuild
How to Setup a Grafana Dashboard Step-by-Step | Grafana Tutorial for Beginners
4 years ago - 16:02

KPeyanski
Is Grafana and InfluxDB really needed for a Home Assistant setup?
1 year ago - 0:24

Grafana
Grafana 12 TL;DR: Observability as Code, Dynamic Dashboards & More Explained in 7 Min | Grafana Labs
2 months ago - 7:19

Christian Lempa
Central Log Management for Docker + Linux // Grafana Loki
4 months ago - 43:35

Techno Tim
Beautiful Dashboards with Grafana and Prometheus - Monitoring Kubernetes Tutorial
2 years ago - 27:41

Techno Tim
Meet Grafana LOKI, a Log Aggregation System for EVERYTHING
3 years ago - 28:13

Better Stack
Monitoring Made EASY with Grafana and Prometheus!
5 months ago - 10:17

Grafana
Get started with Grafana Alerting: Create and receive your first alert
5 days ago - 6:39

Grafana
Grafana Assistant Creates a Dashboard "Out of Thin Air" | AI-Powered Observability | Grafana Labs
1 month ago - 0:42

SubnetSavy
“Monitor Your Kubernetes Cluster in 60 Seconds (Prometheus + Grafana Setup)”
4 weeks ago - 0:21

Nick Chapsas
How to collect metrics and create dashboards using Grafana, Prometheus and AppMetrics in .NET Core
5 years ago - 27:15

Grafana
Grafana 12 in Action: Git Sync, Observability as Code, Dynamic Dasbboards, New APIs, SCIM, and More
1 month ago - 1:20:33

Grafana
The easiest way to get started with Grafana k6 #grafana #k6 #performancetesting
1 year ago - 0:57

Grafana
Getting Started with Grafana Play - Learn, Explore, and Play with Grafana
1 year ago - 1:13

Grafana
Exploring logs, metrics, and traces with Grafana | Grafana for Beginners Ep. 7
1 year ago - 12:57

Grafana
New Filters UI | Grafana 11.3
7 months ago - 0:42

Abhishek.Veeramalla
DAY-42 | KUBERNETES MONITORING USING PROMETHEUS & GRAFANA |LIVE DEMO |STEPS IN GITHUB | #kubernetes
2 years ago - 40:54

Volkov Labs
Calendar panel 2.1.0 for Grafana #grafana #grafanaplugins #community #opensource
1 year ago - 0:52
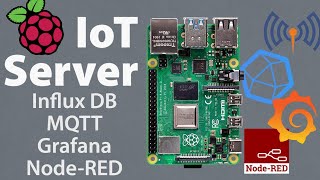
Learn Embedded Systems
Raspberry Pi IoT Server Tutorial: InfluxDB, MQTT, Grafana, Node-RED & Docker
2 years ago - 12:32

Milan Jovanović
This .NET Monitoring Setup Changes Everything: Grafana + OpenTelemetry
2 weeks ago - 11:11

Datahovel
Distributed Tracing #grafana #distributedTracing #GrafanaTempo #opentelemetry #observability
6 months ago - 1:07

AI BOOST
How to Set Up Grafana in 30 Seconds 🔥 #techhacks
3 months ago - 0:27

Coder Trader
Grafana Tutorial: Visualize CPU & Finance Data!
2 months ago - 0:25

Techdox
Effortless Server Monitoring: Install Grafana, Prometheus & Node Exporter with Docker!
1 year ago - 32:12

Rayan Slim
Grafana & Prometheus Tutorial: Create a COMPLETE Dashboard
7 months ago - 57:22

Grafana
Contextual root cause analysis in Grafana Cloud
9 months ago - 4:19

DevOps Shack
30 Days Of DevOps | Zero To Hero | Monitoring With Grafana | Day-21
2 years ago - 39:16
Grafana
How to Create and Work with Variables | Grafana
1 year ago - 7:17

SiW
Grafana – Powering Instagram & SIW Smart iLab Works!
4 months ago - 0:32

Jim's Garage
Homelab Monitoring Made Easy - Part 1: Tools Overview - Grafana, Prometheus, InfluxDB, Telegraf
1 year ago - 25:28

Sesto
WTF does Grafana do in under 100 seconds
5 months ago - 1:58

Volkov Labs
Data Manipulation 3.0.0 for Grafana #api #grafana #opensource #community
1 year ago - 1:00
Grafana
Grafana 12 in Action: Git Sync, Observability as Code, Dynamic Dasbboards, New APIs, SCIM, and More
1 month ago - 1:20:33

Volkov Labs
The Business Media panel 6.1.0 for Grafana #grafana #image #plugins #media #opensource #community
10 months ago - 0:54

2GuysTek
Dashboards for DAYS! - How we use Grafana in our #homelab!
3 years ago - 9:53

Aniket Shinde
Keycloak authentication in grafana #keycloak #grafana #sso
1 month ago - 0:16

Volkov Labs
Business Intelligence App 1.2.0 for Grafana #Grafana #BusinessIntelligence #Alerting
1 year ago - 0:55

DefHawk
🚨 Exploit PoC: Grafana RCE Vulnerability #grafana #cybersecurity #infosec #exploit
6 months ago - 0:25

Grafana
What is Grafana Alloy? Introducing an OSS Telemetry Collector That's 100% OTLP Compatible | Grafana
1 year ago - 0:51

ngulikQid
How to Create Dashboard for Monitoring Resources of Virtual Memory - Grafana and Prometheus #shorts
6 months ago - 0:16

Datahovel
Add Label Filters to your Grafana Loki Dashboards #loki #logs #grafana #observability
2 years ago - 0:44

Grafana
Come say hi at the Grafana booth at KubeCon EU 2025 IN London today! #grafana
3 months ago - 0:33

Devops With Mike
What is #Grafana !!! #devops #prometheus #aws #azure #devopswithmike @devops
7 months ago - 0:48

NeuralNine
Monitor Your Python Applications with Prometheus & Grafana
3 weeks ago - 31:57

Volkov Labs
Dynamic Text 4.2.0 for Grafana #grafana #text #plugins #opensource #community
1 year ago - 1:00

Volkov Labs
Base64 Image/Media panel 4.0.0 for Grafana #grafana #image #plugins #opensource #community
1 year ago - 0:52

Grafana
How to query Grafana Loki with LogQL
1 month ago - 13:11

Volkov Labs
Grafana EventBus to facilitate panels' interconnectivity | Business Charts 6.1.0
1 year ago - 1:00